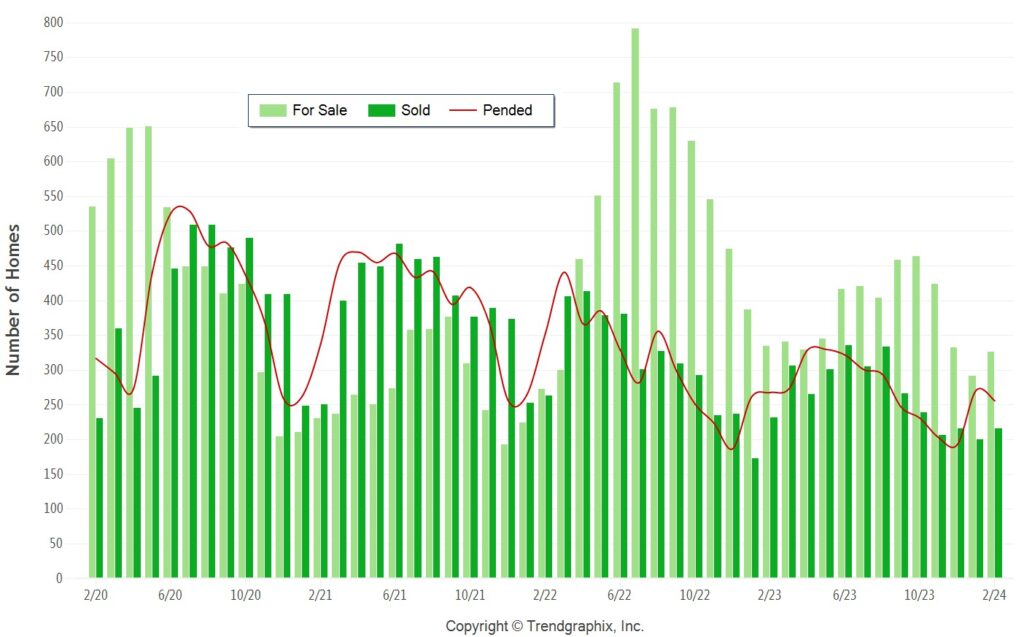
Let’s take a closer look at the real estate market using graphs. The graph above shows the number of homes for sale, pending sales, and closed sales in Lincoln, Roseville, and Rocklin. I widened the data range to get a better idea of the market trends. What stands out is that there aren’t many homes available for sale, which usually means prices go up.
Now, when interest rates go up, like they recently have, you would expect prices would drop. That’s because higher interest rates mean higher monthly mortgage payments. But here’s the thing: when interest rates rise, fewer people want to sell their homes because they don’t want to pay more per month on their mortgage. This is what kept prices stable, despite the higher interest rates.

The graph above shows the average prices of homes sold since 2009 (the green line) and the original average list prices (the red line). This helps us see how prices have changed over time. from 2009 to today, it shows an 8.2% average increase per year. It’s very similar to prices in Twelve Bridges as I described earlier.
In simple terms, these graphs tell us that even though there aren’t many homes for sale and interest rates have gone up, prices haven’t dropped like you might expect.
Property Values
The graph below illustrates the average prices of homes in Twelve Bridges since 2009. It’s important to note that the graph provides an estimate for the area and doesn’t consider variations in pricing, such as more expensive homes in Catta Verdera. Based on this data, the average annual increase in home values for Twelve Bridges properties since 2009 is approximately 8.33%. The green line is the average price for homes sold.

This graph below shows the price per square foot of Twelve Bridges homes from 2009 to 2023, starting at $131 per square foot in 2009 and reaching $324 per square foot by 2023. Over this period, the average annual percentage increase in price per square foot is approximately 9.32%.